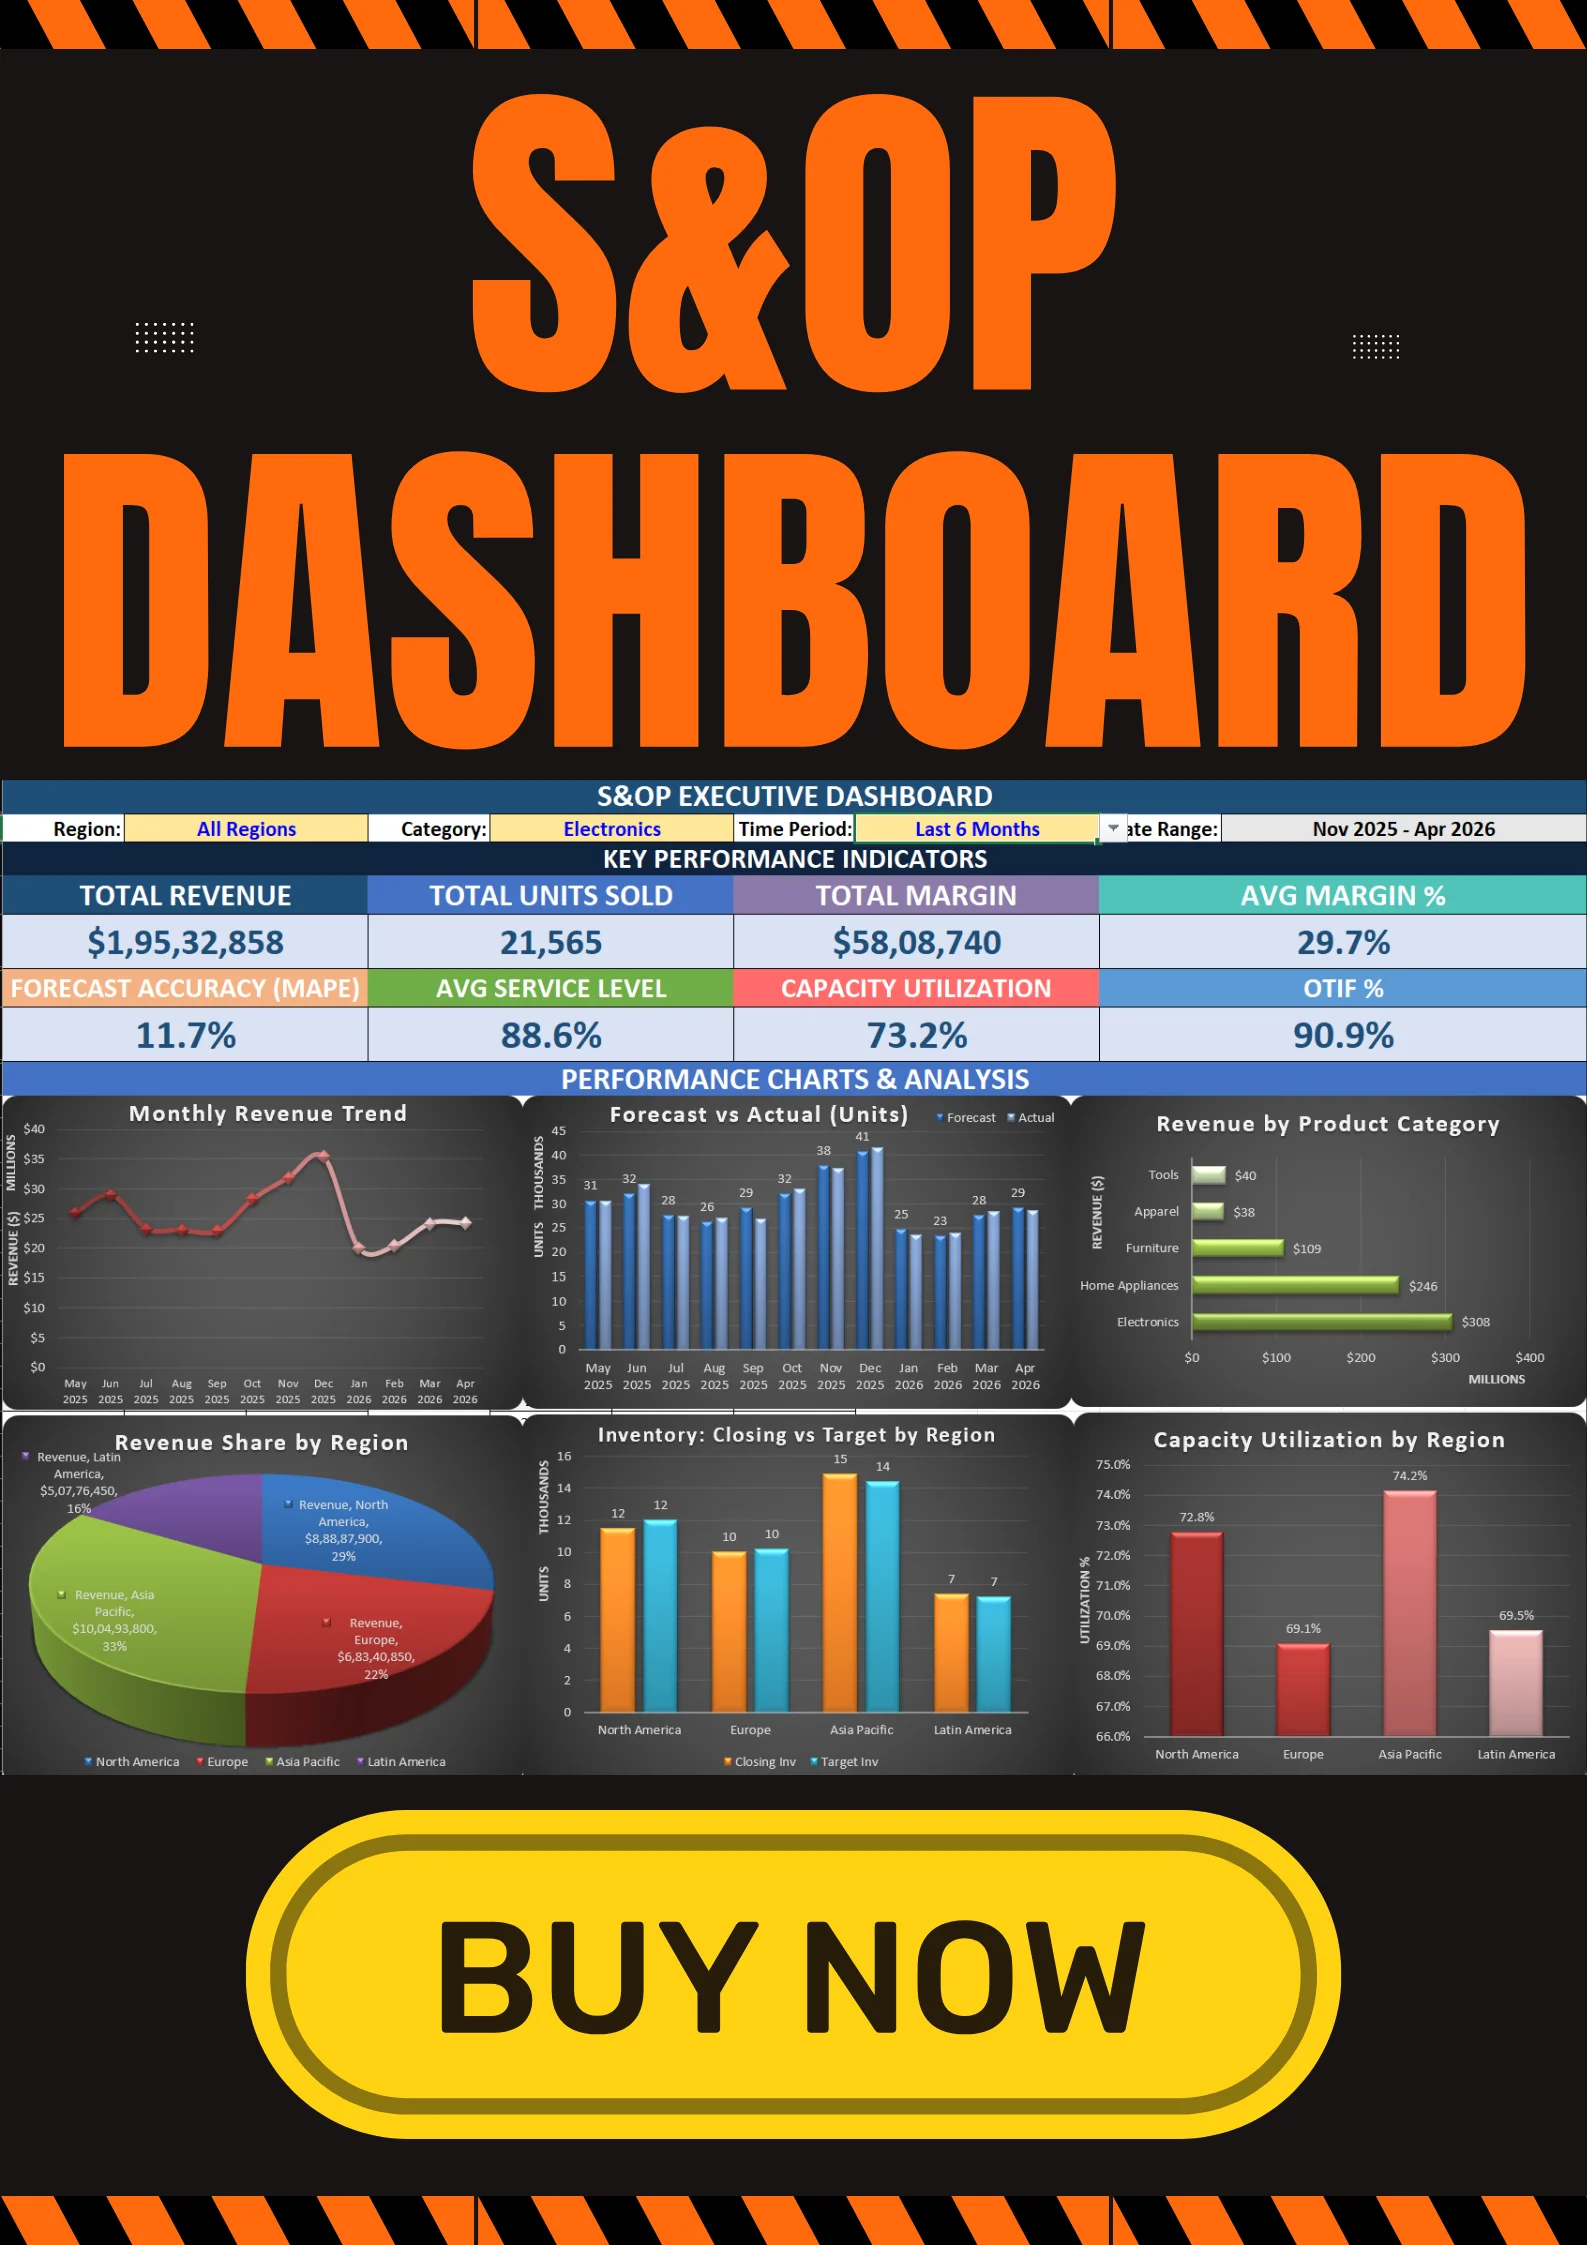
S&OP Dashboard Excel Template | Demand & Supply Planning with KPI Tracking
Align Demand, Supply & Inventory — All in One Place
Most supply chains don’t fail because of execution…
They fail because:
👉 Demand and supply are not aligned.
This S&OP Dashboard Excel Template helps you bring everything together:
✔ Demand planning
✔ Supply planning
✔ Inventory visibility
🚀 What This Template Helps You Do
With this dashboard, you can:
- Compare Demand vs Supply in real time
- Track key S&OP KPIs
- Identify gaps and risks instantly
- Improve planning accuracy
- Support monthly S&OP meetings with data
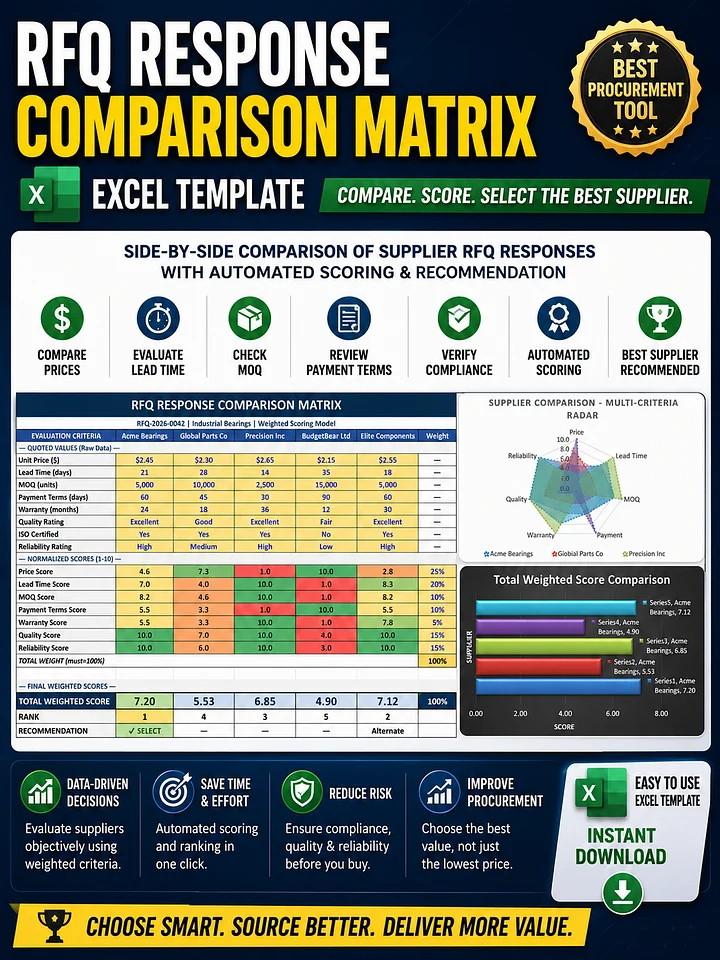
📌 Key Features
✔ Ready-to-use interactive dashboard
✔ Demand vs Supply comparison view
✔ Inventory tracking integration
✔ KPI tracking (fill rate, gap analysis, etc.)
✔ Easy data input (no advanced Excel skills required)
📈 Key KPIs Covered
- Demand vs Supply Gap
- Inventory Levels
- Service Level / Fill Rate
- Forecast Accuracy (if added)
- Planning Variance
🎯 Who Should Use This Template
- Demand Planners
- Supply Chain Managers
- Operations Teams
- Inventory Managers
- S&OP / IBP Professionals
💡 Real Business Impact
Using this template helps you:
👉 Reduce stockouts
👉 Avoid excess inventory
👉 Improve cross-functional alignment
👉 Make faster, data-driven decisions
📂 What You Get
- Fully functional S&OP Excel Dashboard
- Structured input sheets
- Ready KPI visualizations